Consumer price inflation has remained subdued, yet several measures of producer price inflation have risen sharply in recent months. One source of this increase may be an increase in the cost of imported inputs, which is itself influenced by the foreign exchange value of the dollar. In 2014, the U.S. dollar rose nearly 25 percent over a two-year period, putting downward pressure on import prices and contributing to a decline in producer prices. But by the beginning of 2017, the dollar had stabilized at a near 15-year high, easing downward pressure on the cost of imported intermediate inputs. As a result, producer price inflation increased during the first half of 2017, suggesting the dollar’s long-standing headwind to inflation may have subsided.
Fluctuations in the exchange rate directly affect the cost of imported goods, including the cost of imported intermediate inputs. Chart 1 shows the strong inverse relationship between the value of the dollar and aggregate import prices. The green line plots year-over-year changes in the broad dollar index, which aggregates several key exchange rates into a single index. The blue line plots year-over-year changes in the U.S. import price index, which clearly falls as the dollar appreciates and rises as the dollar depreciates._
Chart 1: U.S. broad dollar index and import price index
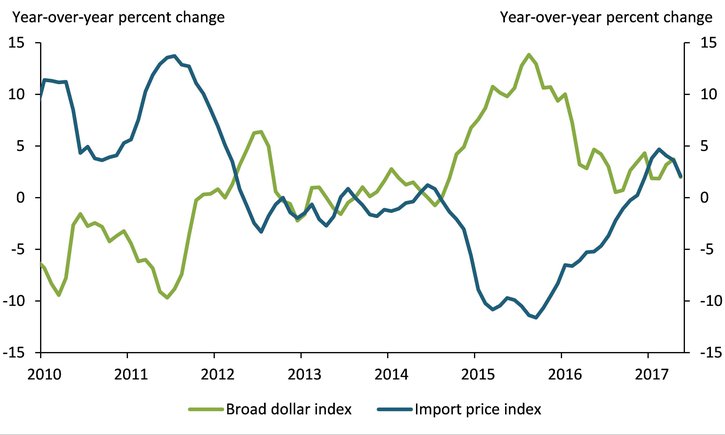
Sources: Board of Governors of the Federal Reserve System and Bureau of Labor Statistics
Changes in the value of the dollar can create significant cost shocks for U.S. producers that import a significant portion of their intermediate inputs. When the U.S. dollar appreciates, for example, the cost of imported inputs falls, potentially allowing producers to pass these lower import costs through to their customers. However, several economic factors are associated with producers’ willingness and ability to fully pass through import cost shocks to their customers, including the position of producers along the supply chains._
To examine the size of this pass-through for producers at various stages of intermediate production, we use the producer price index (PPI), an index from the Bureau of Labor Statistics (BLS) that measures average changes in the prices domestic producers receive for their output._
In Chart 2, we plot the year-over-year change in the PPI for producers at four intermediate stages of the supply chain. The stage classifications are from the BLS and defined such that production flows from stage 1 intermediate demand to stage 4 intermediate demand. Producers in stage 1 produce goods, such as natural gas and plastics, and services such as advertising. These producers primarily sell their goods and services to producers classified in stage 2 intermediate demand, who in turn sell to producers in stage 3 and so on until stage 4, which includes producers of goods and services primarily sold to final demand (presonal consumption, capital investment, government purchases, and exports). The PPIs for each stage indicate the price levels for goods and services received by the producers operating in that position along the supply chain.
Producers in stages 1 and 2 of intermediate demand lower their prices as the U.S. dollar appreciates and the cost of imported inputs falls, leading to overall reductions in the respective PPIs. Chart 2 shows that in 2014, the import price inflation (black line) fell by more than 10 percentage points year over year. At the same time, PPI inflation in stages 1 and 2 (the blue and green lines, respectively) also fell by more than 10 percentage points. However, the decline in PPI inflation was much less for stage 3 producers (yellow line), and below 2 percentage points for producers in stage 4 (burgundy line). The limited pass-through of changes in the cost of imported intermediate inputs at later stages of production is also apparent in 2010, when import prices were rising.
Chart 2: The import price index and the producer price index by stage of production

Source: Bureau of Labor Statistics
More recently, the dollar has stabilized, and import prices have begun to firm, supporting PPI inflation at all stages of production. Since the beginning of 2017, import prices have risen an average of 3.7 percent at an annual rate, and PPI inflation has averaged 4.9 percent across all stages.
The stronger association between import price growth and PPI inflation for firms in stages 1 and 2 of the supply chain does not imply these firms are more exposed to exchange rate fluctuations. In fact, producers in stages 3 and 4 of the supply chain may be more exposed to import cost shocks. Exchange rate fluctuations affect producers in the later stages of production directly through their own import activity and indirectly through their purchases of goods from stage 1 and 2 producers that use imported inputs.
To illustrate this difference in exposure, Chart 3 shows the value of imports by producers at each stage of production as a share of output in 2015, the latest year for which we have data. The import shares for producers in intermediate stages 1 and 2 are approximately 8 and 5.5 percent, respectively. The import shares for producers in stages 3 and 4 are slightly larger at approximately 9 and 13 percent. That PPIs at later stages of production are less sensitive to exchange rate fluctuations—despite their greater exposure to them—suggests that producers at the end of the supply chain have lower pass-through of import cost shocks to their customers.
Chart 3: Imports as a share of output by stage of production

Source: Bureau of Economic Analysis
In recent years, declining import prices posed a substantial headwind to overall price inflation (Smith). Throughout 2016, statements from the Federal Open Market Committee cited the prices of non-energy imports as a key reason that inflation ran below the Committee’s 2 percent objective. The evidence discussed here indicates the headwinds were strongest for sectors of the U.S. economy near early stages of aggregate supply chains. Although, as Clark documents, producer price inflation is not always a good predictor of consumer price inflation, recent data suggests the headwinds from the strong dollar may be subsiding.
Endnotes
-
1 The inverse relationship between the dollar and import prices is muted if fuel is excluded from the import price index. This is because the prices of many commodities that are priced in dollars, such as fuel, tend to decline when the dollar appreciates and rise when the dollar depreciates.
-
2 Other factors that influence the pass-through of exchange rate shocks include the vehicle currency used in international trade contracts, product differentiation, and the duration of importer-exporter relationships (Gopinath; Gopinath and others; Heise). These factors may be related to position within a supply chain, as the level of product differentiation or the types of importer-exporter relationships vary according to the intermediate stage of production.
-
3 An important difference between the producer price index and measures of consumer prices such as the consumer price index and the personal consumption expenditure price index is that the producer price index measures only the prices received by domestic producers, while the consumer price indexes reflect the prices consumers pay, including the prices for imported goods and services. As a result, while fluctuations in the dollar have only an indirect effect on producer prices through their effect on imported intermediate inputs, the dollar may have a direct effect on the prices of imported goods and services purchased by consumers.
References
Clark, Todd. 1995. “Do Producer Prices Lead Consumer Prices?” Federal Reserve Bank of Kansas City, Economic Review, vol. 80, no. 3, pp. 25–39.
Gopinath, Gita. 2016. “The International Price System.” Federal Reserve Bank of Kansas City, Inflation Dynamics and Monetary Policy, proceedings of the 2015 Jackson Hole Economic Policy Symposium, pp. 71–150.
Gopinath, Gita, Oleg Itskhoki, and Brent Neiman. 2012. “External LinkTrade Prices and the Global Trade Collapse of 2008–09.” IMF Economic Review, vol. 60, no. 3, pp. 303–328.
Heise, Sebastian. 2016. “External LinkFirm-to-Firm Relationships and Price Rigidity: Theory and Evidence” CESifo Working Paper no. 6226, November.
Smith, A. Lee. 2016. “How Much of the Fall in Inflation Can be Explained by Energy and Import Prices?” Federal Reserve Bank of Kansas City, The Macro Bulletin, January.
George A. Kahn is a vice president and economist at the Federal Reserve Bank of Kansas City. Nicholas Sly is a senior economist at the bank. Amy Oksol, a research associate at the bank, helped prepare the bulletin. The views expressed are those of the authors and do not necessarily reflect the positions of the Federal Reserve Bank of Kansas City or the Federal Reserve System.
Author