Predicting future macroeconomic outcomes with precision is difficult. Policymakers pay close attention to the uncertainty around a particular forecast, as a high degree of uncertainty may suggest a greater potential for extreme economic outcomes. One way to reduce uncertainty around forecasts is to incorporate timely data on current economic conditions. However, many data series used in forecasting are released with a lag. For example, the Bureau of Economic Analysis (BEA) releases the official quarterly estimate of U.S. gross domestic product about one month after the end of the relevant quarter.
To address this lag, forecasters have developed a variety of real-time GDP forecasting models that use available high-frequency macroeconomic indicators to forecast GDP before the official release. Bae and Doh (2019) introduce one such real-time GDP forecasting model that combines an accounting-based aggregation of individual economic indicators with a statistical approach that extracts the common component of economic indicators. This “tracking model” tracks the current quarter GDP at a daily frequency based on the available data.
We use real-time GDP forecasts from the tracking model in Bae and Doh (2019) to estimate a distribution of potential outcomes for 2019 Q4-over-Q4 GDP growth during the fourth quarter of 2018 at a weekly frequency._ Chart 1 shows that these forecasts are widely distributed. The median estimate, which is in the center of the forecast distribution (orange line) is relatively close to the actual GDP growth rate of 2.34 percent (gray dashed line) at the end of the fourth quarter of 2018; however, the 95th percentile estimate predicts around 4 percent GDP growth, while the fifth percentile estimate predicts around −1 percent GDP growth. The large difference between these forecasts suggests a high degree of uncertainty about the most likely outcome. In sum, the chart shows that forecasts using only real-time GDP forecasting data carry a high degree of uncertainty, presenting a risk for policymakers.
Chart 1: Forecasting 2019 Q4-over-Q4 GDP growth using only real-time GDP forecast data produces highly uncertain estimates
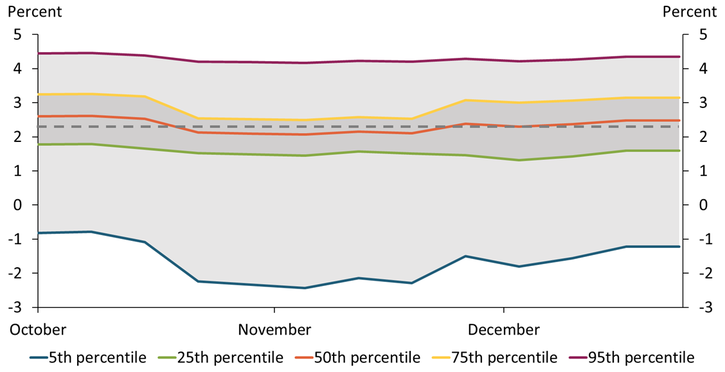
Note: The gray dashed line indicates the observed 2019 Q4-over-Q4 GDP growth of 2.34 percent.
Source: Authors’ calculations.
One way to improve forecast accuracy is to add financial market variables that capture investors’ expectations for the future. For example, news about fiscal and trade policies that could affect future GDP may be reflected immediately in financial market indicators, while current macroeconomic indicators may not respond to news as quickly. Chart 2 shows how the forecast improves when adding data from the Chicago Fed National Financial Conditions Index as well as the stock price and interest rate spreads in Carriero, Clark, and Marcellino (2020) to forecasts for 2019 Q4-over-Q4 growth._ Starting in mid-October, the median estimate of this forecast is on average closer to the observed outcome than the estimate from the model based purely on real-time GDP forecasts shown in Chart 1.
Chart 2: Weekly forecast of 2019 Q4-over-Q4 GDP growth using real-time GDP forecast data along with financial market indicator data exhibits less uncertainty and more stable estimates
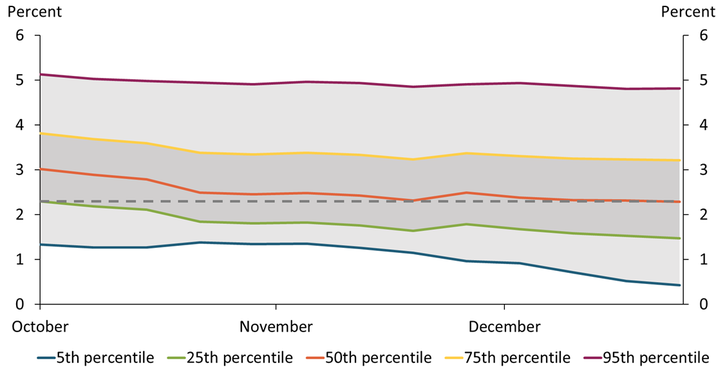
Note: The gray dashed line indicates the observed 2019 Q4-over-Q4 GDP growth of 2.34 percent.
Sources: Federal Reserve Bank of Chicago (Haver Analytics), Board of Governors of the Federal Reserve System (Haver), S&P Global Ratings (Haver), BEA (Haver), and authors’ calculations.
Comparing Charts 1 and 2 reveals an additional finding: the model based only on real-time GDP forecasts may overstate the downside risk (50th quantile to fifth quantile) relative to the model with financial market conditions. The tracking model estimate is sensitive to volatile monthly indicators of inventories and net exports, while financial market variables are more focused on the future direction of indicators of consumption and investment that capture the underlying strength of the economy. By incorporating financial market data, Chart 2 is able to produce more narrowly distributed forecasts, especially for lower percentiles. The narrower gap between the fifth and 50th percentile forecasts reduces uncertainty about the potential for extremely low GDP growth. Thus, including financial market conditions in forecasting models may help policymakers better assess the downside risks to future GDP growth._ In addition, the median forecast shown in Chart 2 converges to within 0.2 percentage points of actual GDP growth by the fourth week of October and remains nearer to the observed outcome than the median estimate shown in Chart 1 for all but one week thereafter. The final median estimate shown in Chart 2 is closer to the observed outcome than the estimate shown in Chart 1 by 0.08 percentage points._
Given the improvement in assessing uncertainty about future GDP growth from incorporating financial market data, we next compare forecasts from the same two models—the model using only GDP real-time economic forecasting and the model that adds financial market data—for 2021–22 GDP. We first estimate five different quantile forecasts for 2022 Q1-over-Q1 GDP growth using the model based only on real-time GDP forecasts. Chart 3 shows that these estimates fluctuate widely over the forecast period across the distribution, suggesting that real-time GDP forecasts are very sensitive to the release of monthly economic indicators because they use only these indicators as inputs. For example, stronger-than-expected March retail sales boosted real-time GDP forecasts for 2021:Q1 and, accordingly, the forecast for 2022 Q1-over-Q1 GDP growth.
Chart 3: Forecasting 2022 Q1-over-Q1 GDP growth using only real-time GDP forecast data yields sizable swings in upside and downside risk throughout the quarter
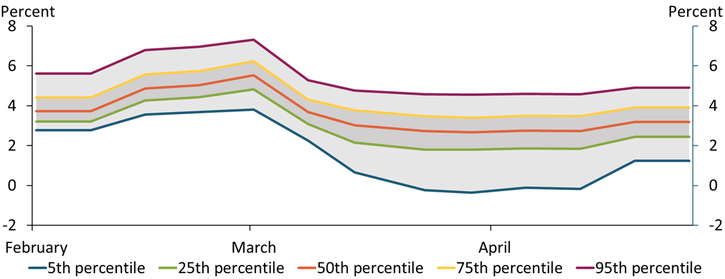
Source: Authors’ calculations.
Chart 4 illustrates outcomes from the model with financial market conditions and shows that including financial market data once again produces a more stable forecast over the course of the quarter. One reason for this improved stability is that market participants are forward-looking and incorporate information into their forecasts that is not contained in publicly released economic indicators. For example, news about the accelerated vaccine rollout will immediately boost GDP forecasts of market participants even though this information has not yet materialized in real-time GDP forecasts based solely on economic indicators. Interestingly, the most recent estimate (as of April 28, 2021) suggests a 24.5 percent probability of GDP growth above 4 percent in 2022:Q1 (compared with a 22.2 percent probability in the real-time GDP forecast-only model)._ As in the previous examples, including financial market conditions reduces the volatility of tracking estimates of future GDP growth. For instance, the median forecasts of 2022 Q1-over-Q1 GDP growth between February and April 2021 from the model with financial market indicators are centered around 3.2 percent, while those from the model with only macroeconomic indicators exhibit wide swings during the same period before reaching a similar level by the end of the forecast period. In addition, the model with financial market indicators more quickly stabilizes downside risk to the level observed by the end of the forecast period.
Chart 4: Weekly forecast of 2022 Q1-over-Q1 GDP growth using both real-time GDP forecast data along with financial market indicator data provides a more stable forecast throughout the quarter
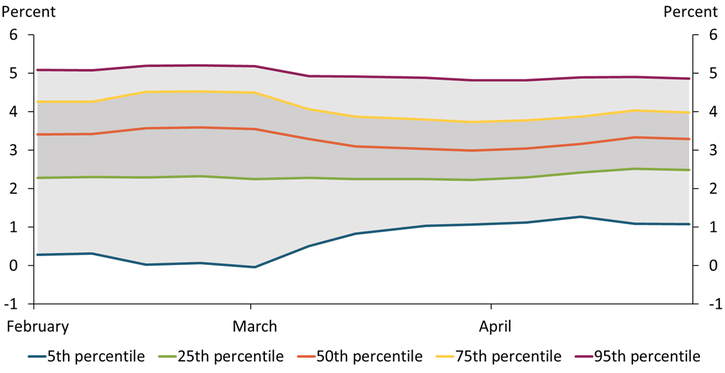
Source: Authors’ calculations.
Overall, our results suggest that forecasters can yield more informative and timely estimates of future macroeconomic conditions by incorporating financial market conditions into their forecasting models. We find that including financial market indicators in addition to macroeconomic indicators reduces volatility in our real-time estimates of future GDP growth. In particular, forecasts based solely on current macroeconomic conditions yield more volatile estimates of the downside risk to GDP growth. As a result, incorporating financial market indicators may help policymakers better gauge the risk of extreme outcomes, such as unexpectedly low GDP growth.
Endnotes
-
1 We estimate 2019 rather than 2020 Q4-over-Q4 GDP growth because the COVID-19 shock and unprecedented lockdown broke the normal statistical pattern.
-
2 Specifically, we create an index of financial market conditions comparable to the real-time GDP forecast by first estimating the quarterly average of financial market indicators based on available weekly data during the tracking period. We follow Carriero, Clark, and Marcellino (2020) by extrapolating future weekly values using the weighted average of past weekly values and then obtain the real-time GDP forecast for the quarterly value. We use the Mixed Data Sampling (MIDAS) regression as explained by Ghysels, Santa-Clara, and Valkanov (2004).
-
3 Carriero, Clark, and Marcellino (2020) perform more rigorous statistical tests of the forecast accuracy from two different models with or without financial market conditions and show that including financial market conditions improves the accuracy of both point forecasts and density forecasts of GDP growth.
-
4 The final median in Chart 1 is 2.48 and the final median estimate shown in Chart 2 is 2.28. The realized value was 2.34.
-
5 When we apply the first estimate of 2021:Q1 GDP by the BEA instead of the tracking estimate to forecasting, the model without financial conditions implies a slightly higher probability for strong growth (31.9 percent versus 31 percent). However, the model with financial conditions generates higher growth at the upside. The top 25th percentile outcome is 4.2 percent for both models, but the top fifth percentile outcome is 5.24 percent for the model with financial conditions and 5.17 percent for the model without financial conditions. In contrast, when we use the last 2021:Q1 tracking estimate, which was 1.3 percent lower than the BEA’s first estimate, the top 25th percentile outcome was higher (3.98 percent versus 3.91 percent) but the top fifth percentile outcomes was slightly lower (4.86 percent versus 4.91 percent) in the model with financial conditions.
References
Bae, Jaeheung, and Taeyoung Doh. 2019. “External LinkTracking U.S. GDP in Real Time.” Federal Reserve Bank of Kansas City, Economic Review, vol. 104, no. 3, pp. 5–19.
Carriero, Andrea, Todd E. Clark, and Massimiliano Marcellino. 2020. “External LinkNowcasting Tail Risks to Economic Activity with Many Indicators.” Federal Reserve Bank of Cleveland, working paper 20-13, May.
Ghysels, Eric, Pedro Santa-Clara, and Rossen Valkanov. 2004. “External LinkThe MIDAS Touch: Mixed Data Sampling Regression Models.” CIRANO, Scientific Series, 2004s-20, May.
Thomas R. Cook is a data scientist at the Federal Reserve Bank of Kansas City. Taeyoung Doh is a senior economist at the bank. The views expressed are those of the authors and do not necessarily reflect the positions of the Federal Reserve Bank of Kansas City or the Federal Reserve System.
Authors

Thomas R. Cook
Data Scientist