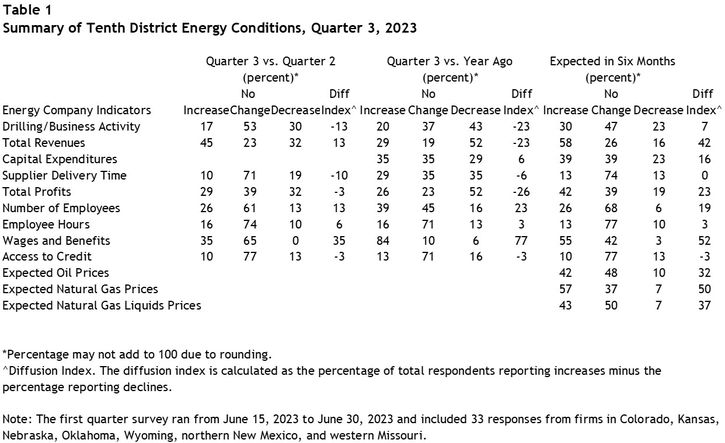
Summary of Quarterly Indicators
Tenth District energy activity continued to decline in the third quarter of 2023, as indicated by firms contacted between Sept. 15th, 2023, and Sept. 29th, 2023 (Tables 1 & 2). The drilling and business activity index increased from -19 to -13 (Chart 1). The number of employees and employee hours indexes cooled and access to credit declined slightly, while all other indexes increased from previous readings.
Chart 1. Drilling/Business Activity Indexes
Skip to data visualization table| Quarter | Vs. a Quarter Ago | Vs. a Year Ago |
|---|---|---|
| Q3 19 | -23 | -21 |
| Q4 19 | -48 | -50 |
| Q1 20 | -81 | -92 |
| Q2 20 | -62 | -70 |
| Q3 20 | 4 | -71 |
| Q4 20 | 40 | -60 |
| Q1 21 | 35 | 12 |
| Q2 21 | 33 | 59 |
| Q3 21 | 43 | 68 |
| Q4 21 | 32 | 74 |
| Q1 22 | 29 | 52 |
| Q2 22 | 57 | 77 |
| Q3 22 | 44 | 78 |
| Q4 22 | 6 | 56 |
| Q1 23 | -13 | 17 |
| Q2 23 | -19 | -16 |
| Q3 23 | -13 | -23 |
The year-over-year indexes were mixed. Drilling/business activity declined moderately while revenues, profits, and supplier delivery time decreased at a lesser pace than last quarter. Access to credit turned negative. The wages and benefits indexes grew further even as both employment indexes cooled.
All expectations indexes for future activity turned positive in Q3 2023, except access to credit at -3. The future drilling/business activity index rose from -22 to 7, and revenues and profits are expected to grow as well. Additionally, firms expect to sustain their increases in employment and capital expenditures.
Summary of Special Questions
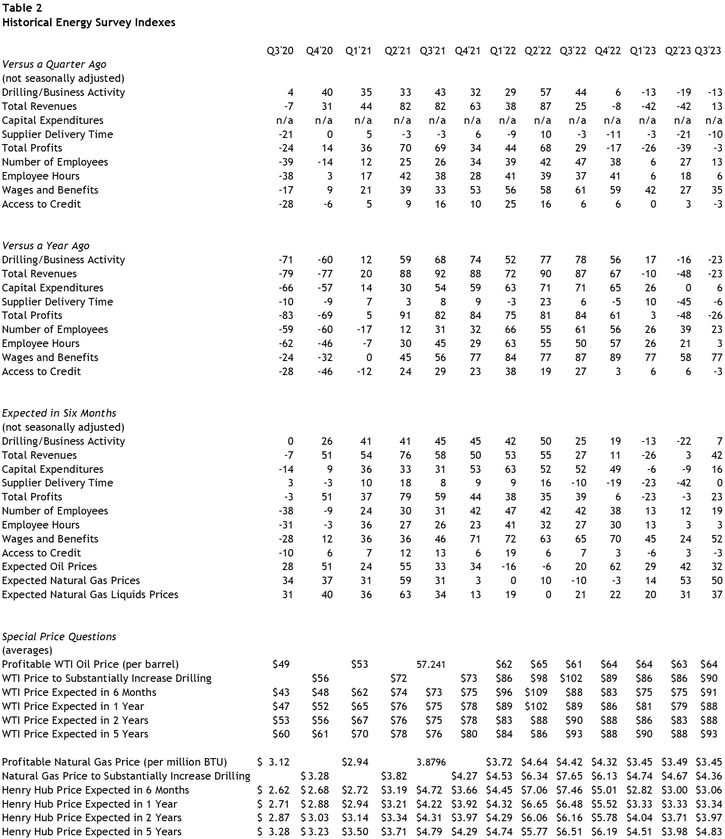
Firms were asked what oil and natural gas prices were needed on average for drilling to be profitable across the fields in which they are active. The average oil price needed was $64 per barrel (Chart 2), while the average natural gas price needed was $3.45 per million Btu (Chart 3). Firms were also asked what prices were needed for a substantial increase in drilling to occur across the fields in which they are active. The average oil price needed was $90 per barrel (Chart 2), and the average natural gas price needed was $4.36 per million Btu (Chart 3).
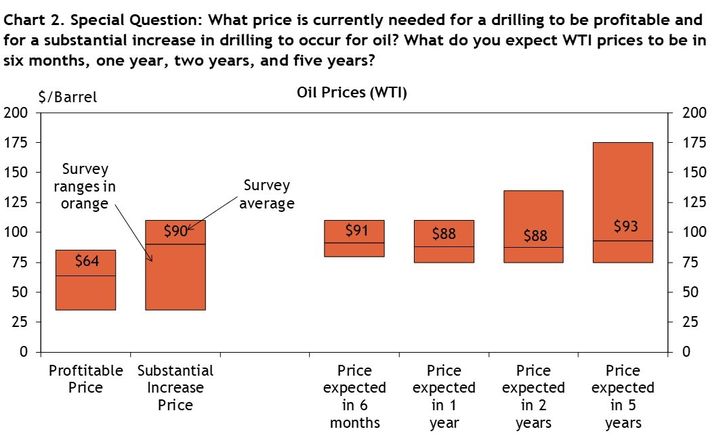
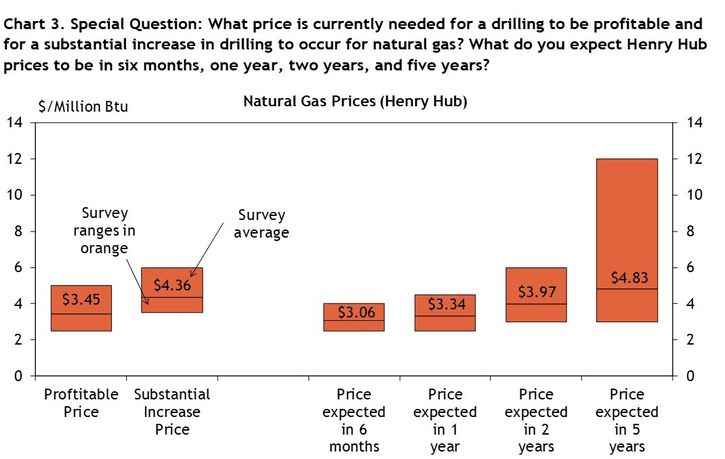
Firms reported what they expected oil and natural gas prices to be in six months, one year, two years, and five years. The average expected WTI prices were $91, $88, $88, and $83 per barrel, respectively. The average expected Henry Hub natural gas prices were $3.06, $3.34, $3.97, and $4.83 per million Btu, respectively.
Contacts were asked what they expect the U.S. rig count to be in six months relative to current levels (Chart 4). 48% of firms expect the number of rigs to be slightly higher, 45% expect it to be about the same, and 3% each expect it to be significantly higher or slightly lower.
Chart 4. Special Question - Do you expect the number of U.S. oil and gas rigs six months from now to be?
Skip to data visualization table| Response | Percent |
|---|---|
| Significantly higher | 3 |
| Slightly higher | 48 |
| About the same | 45 |
| Slightly lower | 3 |
| Significantly lower | 0 |
District energy firms were also asked how productivity has changed at their business over the past year, and how they expect it to change in the next year (Chart 5). 45% of firms reported a slight increase in productivity over the past year, while 31% reported no change, 14% reported a large increase, 7% reported a slight decrease, and only 3% reported a large decrease. However, in the coming year, 70% of firms expect a slight increase in productivity, while nearly a quarter expect no change in productivity, and 3% each expect a slight or large decrease.
Chart 5. Special Question - How has/will productivity (output per unit of input) changed at your business?
Skip to data visualization table| Response | Past Year | Next Year |
|---|---|---|
| Large increase | 14 | 0 |
| Slight increase | 45 | 70 |
| No change | 31 | 23 |
| Slight decrease | 7 | 3 |
| Large decrease | 3 | 3 |
Selected Energy Comments
“It is becoming ever more difficult and expensive to drill and operate. The best spots (geologically) for the best wells will become rarer to find.”
“Gas demand is staying flat or increasing while ability and willingness to drill for gas is declining.”
“Gas burns cleaner than oil and if there is any transition to cleaner fuel, it will be toward natural gas.”
“Our teams are productive independent of price.”
“Completion costs are down 30%.”
“Oil prices are climbing but business is not in high demand.”
“There is not enough available drilling rigs and rig hands to increase our activity above our current activity level.”
“Bakken and Oklahoma have seen increased rig activity.”
“Business is stable.”
“No significant innovation, but better experience level of field personnel.”