Strength in farm real estate values persisted in the second quarter despite some moderation in the farm economy and higher interest rates. Growth in farmland values eased from the surge of recent years, but remained strong through the first half of 2022. Broad improvement in measures of agricultural credit conditions lessened alongside reduced strength in farm incomes and the share of banks reporting weaker conditions grew from recent periods. Many lenders continued to report lower demand for farm loans and a growing share indicated that funding availability had dropped from a year ago.
Conditions in the U.S. farm economy have moderated in recent months, but broad strength in farm finances during recent years continued to support agricultural credit conditions. Margins for many major commodities have thinned in recent months alongside elevated production costs and softening prices. Loan demand has remained subdued for many farm lenders as higher interest rates and an abundance of liquidity on farm balance sheets has reduced credit needs, but many also continued to expect a rebound in the months ahead. Farm loan performance remained historically strong through early 2023 and liquidity levels at many agricultural banks were well positioned to meet growth in lending demand that could be on the horizon.
Second Quarter Federal Reserve District Ag Credit Surveys
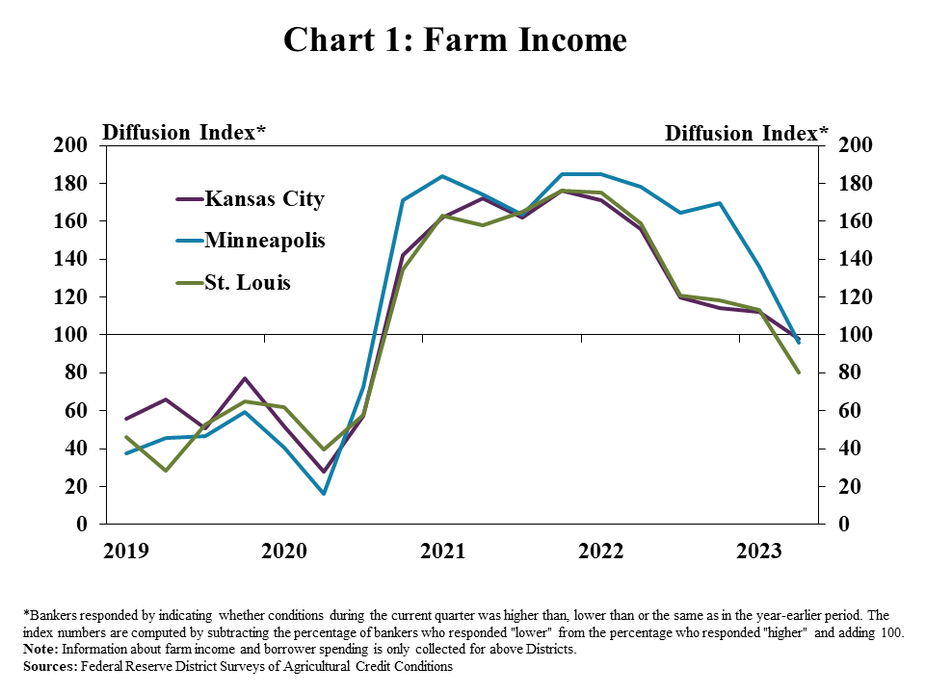
Farm income moderated in all the participating Districts during the second quarter. Following nearly two years of considerable strength, improvement in farm income waned according to Federal Reserve Surveys of Agricultural Credit Conditions (Chart 1). The share of respondents reporting that farm incomes were lower than the same time a year ago grew from recent periods in all regions and was comparatively higher in the St. Louis District.
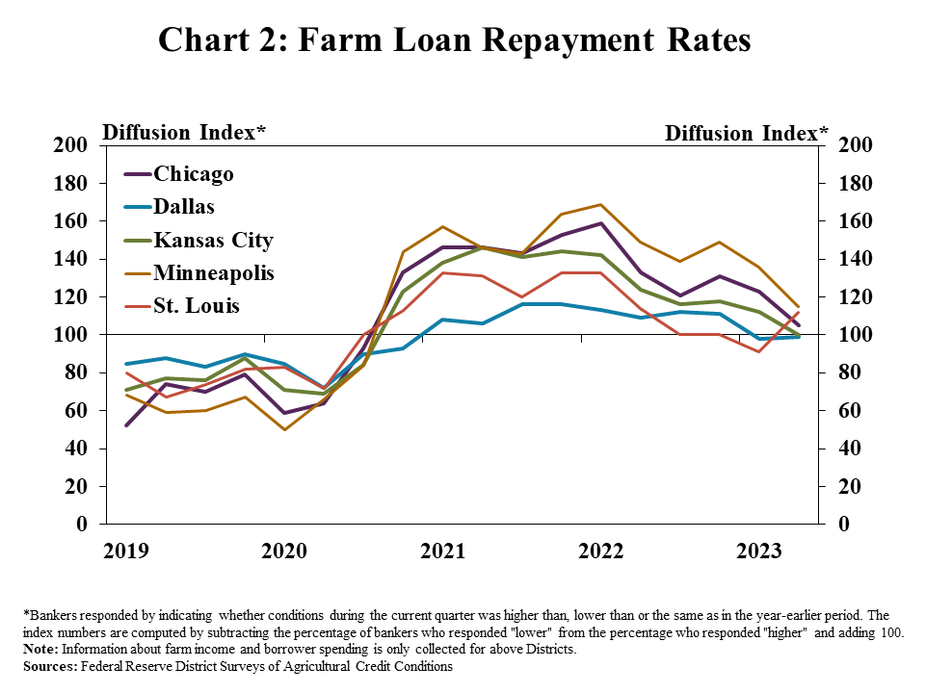
Improvement in farm loan performance also softened alongside a moderation in farm income. The pace of increase in farm loan repayment rates has slowed from a period of significant improvement about a year ago (Chart 2). The share of banks reporting lower repayment rates than a year ago remained 10% or less in all Districts, but the share reporting higher rates of repayment has dropped considerably during recent months in all areas.
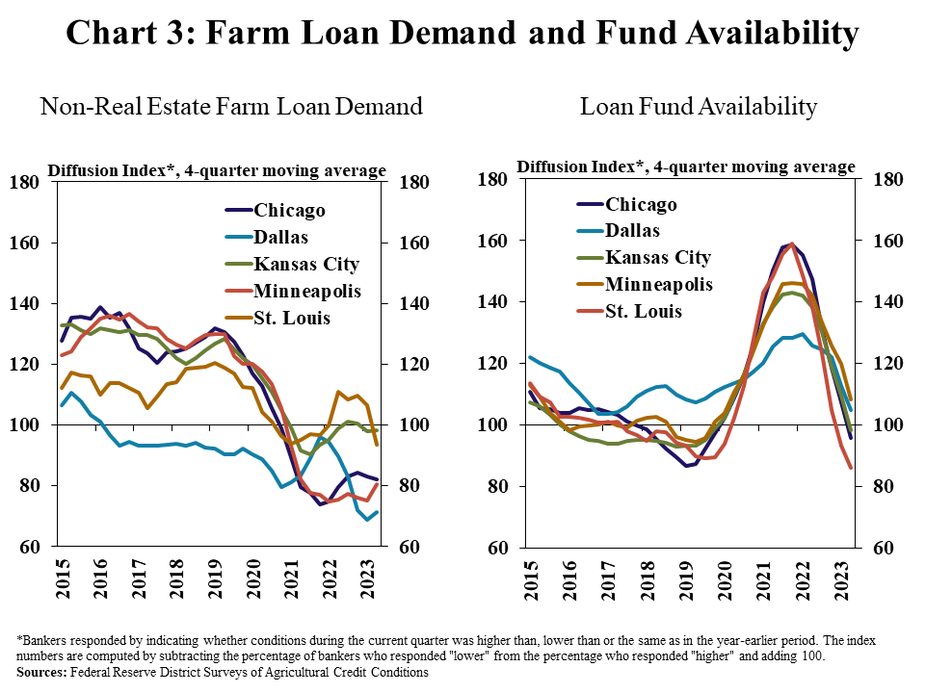
Despite a moderation in farm income, demand for credit remained subdued and bank liquidity softened. Demand for non-real estate loans remained lower than a year ago in all regions and growth in fund availability eased (Chart 3). Loan demand in the St. Louis District declined at a modest pace during the quarter after growing for nearly a year and dropped at a more notable rate in other regions. As deposit balances have moderated from recent surges, the share of banks reporting lower fund availability continued to grow.
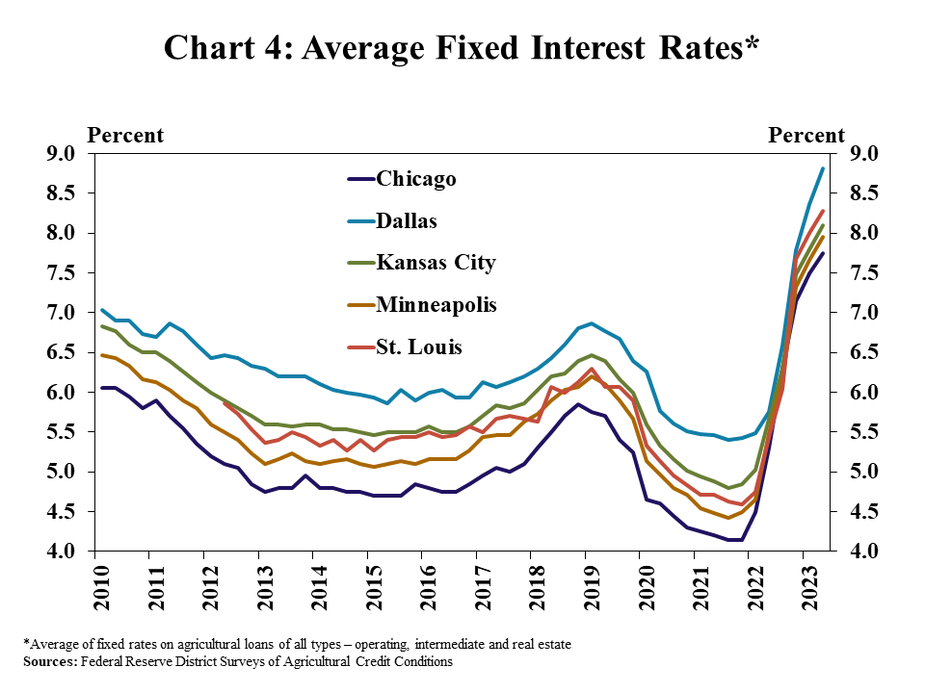
Loan demand remained soft for many lenders alongside a rise in farm loan interest rates. The average fixed interest rate on farm loans across all regions was above 8%, a 30 basis point increase from the previous quarter (Chart 4). Similar to historical trends, the average fixed rate was highest in the Dallas District and lowest in the Chicago District, a difference of 100 basis points between the two regions.
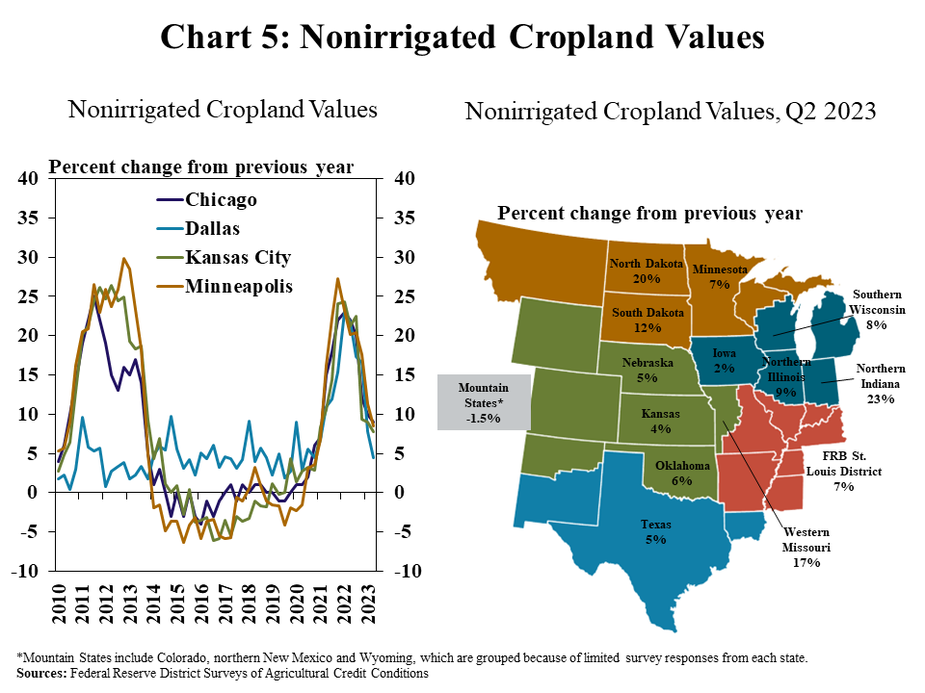
Farm real estate markets remained resilient despite moderation in the farm economy and higher interest rates. The value of nonirrigated cropland increased from a year ago by an average of about 7% in all participating regions (Chart 5). Growth in land values has eased from recent years, but remained steady in most states and considerably stronger in some areas. The growth in farmland values has softened somewhat more for lower-priced land, but a steady supply of land sales and strong demand from farmers has likely supported broad resiliency of real estate values.