In each of the past three years, more people moved out of Oklahoma to live in other parts of the United States than moved in. This reversed a 10-year trend—from 2005 to 2015—in which the state attracted more new U.S. residents each year than it lost. The recent net outflow of people has reduced overall state population growth to the slowest rate since 1990. This edition of the Oklahoma Economist investigates the recent reversal in Oklahoma’s net domestic migration to see where people are migrating, which areas are losing residents, which age and education groups have been leaving and the extent to which out-migration may continue.
A reversal in net domestic migration to Oklahoma
After declining following the 1980s oil bust and then growing slower than the nation in the 1990s and early 2000s, Oklahoma’s population grew faster than the nation from 2006 to 2010 (Chart 1). State population then continued to grow at about the national rate through 2015 before slowing considerably the past three years. In 2017 and 2018, the state’s population grew less than 0.3 percent per year, Oklahoma’s slowest rate of growth since 1990.
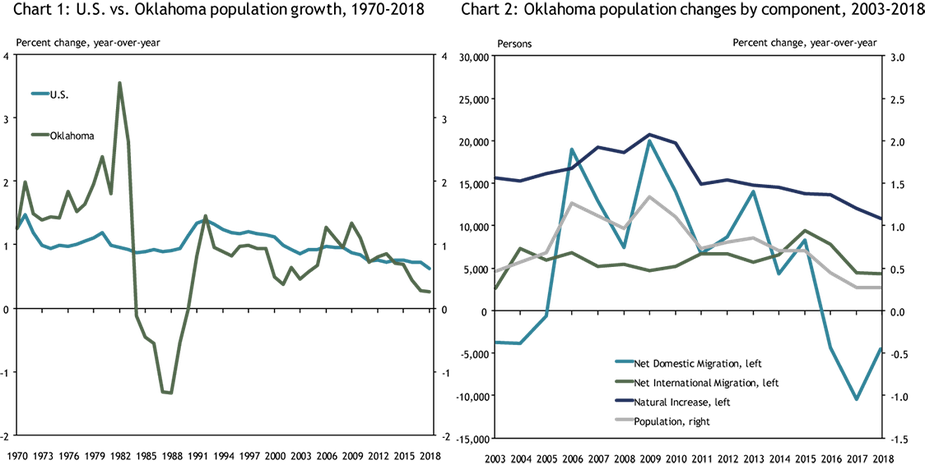
Note: Annual BEA population data used through 2017, Census population data used for the most recent year. Sources: Bureau of Economic Analysis, Census Bureau, and Haver Analytics.
The driving force in Oklahoma’s slowdown in population growth has been a decline in net domestic migration—the number of U.S. residents moving into Oklahoma relative to those moving out. While the state’s rate of “natural” population growth (births minus deaths) has diminished recently—as it has in the nation—and international immigration has slowed, these trends pale in comparison to the reversal in domestic migration flows (Chart 2).
The states gaining the most from Oklahoma’s net outflows of residents in 2016 and 2017 (detailed data are not yet available for 2018) were Arizona and Virginia (Chart 3)._ During the previous decade, Arizona had been one of the top four contributors to net inflows to Oklahoma, surpassed only by Florida (which like Arizona suffered a severe housing bust in the late 2000s), Texas and California (Chart 4). Oklahoma continued to have net positive inflows of residents from Texas and California in 2016 and 2017, although the inflow from California slowed somewhat.
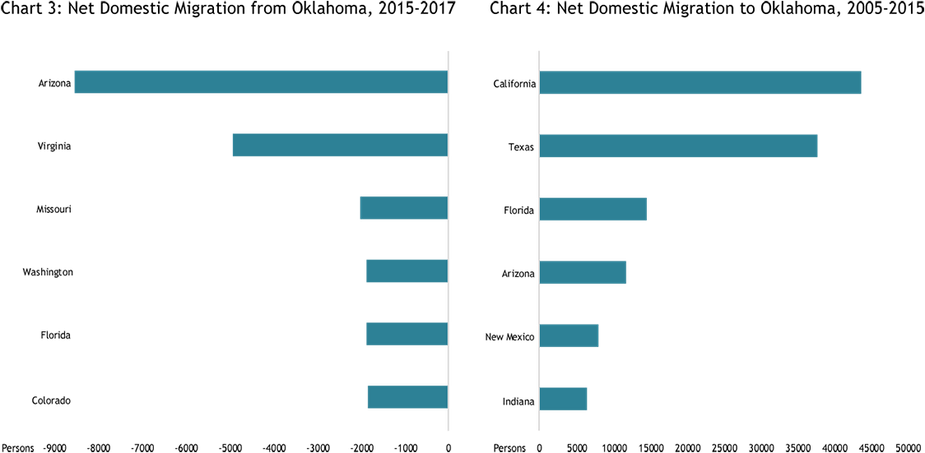
Sources: ACS 1-year sample - Census Bureau and authors' calculations.
Largest outflows were from western Oklahoma
Looking across the state, the steepest drop in net domestic migration in recent years has been in nonmetro areas (Chart 5). By 2017, however, neither the Oklahoma City nor Tulsa metro areas were seeing positive net inflows of people either. Net domestic migration has been slightly negative for the Lawton metro area throughout this decade. A map of net domestic migration by county shows that all of western Oklahoma saw a sizable net outflow of people in 2016 and 2017 following the oil price drop of 2014-15, with all counties losing more than 2 percent of their populations (Map 1)._ Meanwhile, nonmetro areas in most other parts of the state generally saw only modest declines or modest increases. The only counties in Oklahoma to gain significantly from domestic migration in 2016 and 2017 were a handful of suburban counties and a few counties on the Texas and Arkansas borders.
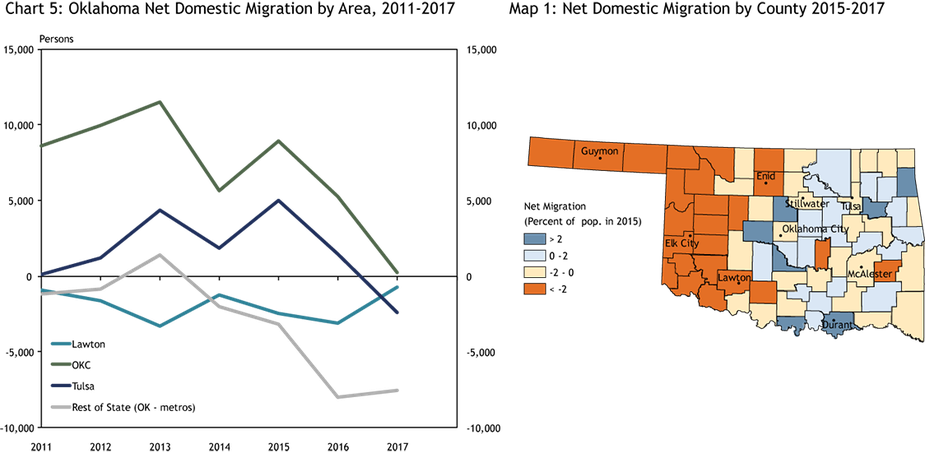
Sources: Population Housing Unit Estimates - Census Bureau and authors' calculations.
In the decade from 2005 to 2015, much of non-metro northwestern and southeastern Oklahoma saw positive net domestic migration flows, as did the two large metro areas (Map 2). These areas likely benefited from generally high energy prices, as well as continued development of Native American enterprises, especially in southeastern Oklahoma. Generally, only far southwestern Oklahoma and parts of the Panhandle saw significant migration outflows from 2005 to 2015. These areas also had net outflows from 1990 to 2005, a period when population generally fell slightly in northwestern Oklahoma but rose slightly in most of eastern Oklahoma and in the two large metros (Map 3).
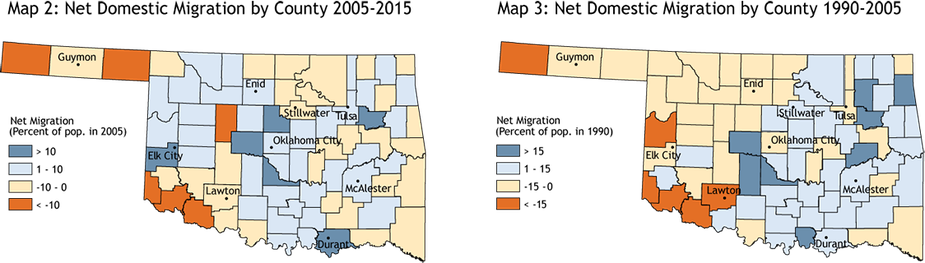
Source: Population and Housing Unit Estimates - Census Bureau and authors' calculations.
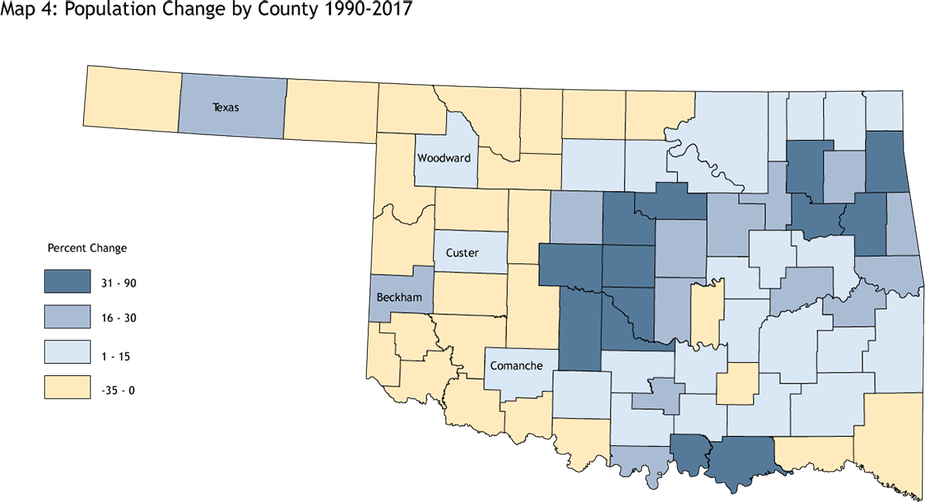
The net overall effect on population from domestic migration flows in recent decades generally is shown in Map 4, which shows total population growth by county from 1990 to 2017. During this period, most of western Oklahoma saw its population decline, despite rising domestic in-migration from 2005 to 2015. The primary exceptions were Texas County in the Panhandle and Beckham County in far western Oklahoma, homes of the regional hubs of Guymon and Elk City. Both of those counties saw their population grow by more than 15 percent since 1990, which in the case of Texas County was driven primarily by international in-migration. Woodward, Custer and Comanche Counties—each also home to regional hub cities—also saw their populations grow from 1990 to 2017, although by less than 10 percent.
Source: Population and Housing Unit Estimates - Census Bureau and authors' calculations.
Net losses have been among highly-educated working age residents
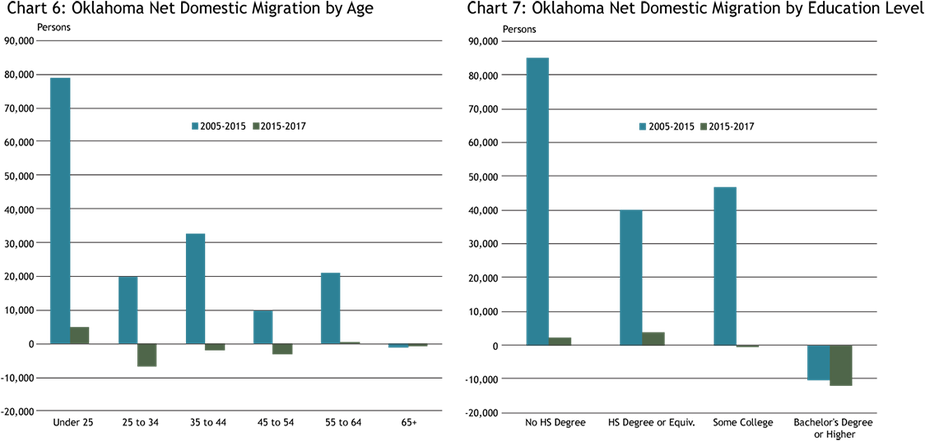
In recent years, the decline in net domestic migration to Oklahoma has been driven by the prime working age population, defined as 25 to 54 years old (Chart 6)._ Of this group, the largest drop was in the youngest segment—25 to 34 years old. Net migration was roughly flat for residents 55 and older, while Oklahoma continued to gain residents younger than 25.
Sources: ACS 1-year sample Public Use Microdata- Census Bureau and authors' calculations.
The recent net loss of prime working age residents was a switch from the 2005 to 2015 period, when those age segments each saw sizable increases in domestic migration. This suggests that a driving force in recent outmigration from the state has been relatively fewer job opportunities than in some other parts of the country. The downturn in the state’s economy following the oil price drop of 2014-15, reviewed in previous editions of the Oklahoma Economist, is consistent with this narrative.
In terms of education, most of the recent drop in net domestic migration has been among those with bachelor’s degrees or higher (Chart 7). Oklahoma actually saw a continued modest net inflow of residents with a high school diploma or less in 2016 and 2017. The net loss of residents with college degrees actually continued a trend from the previous decade, when the state also lost about 10,000 more college-educated people than it gained. Thus, economic difficulties in the state following the drop in oil prices do not appear to be the only reason for the greater outflow of higher-educated workers, although the pace of college-educated residents leaving Oklahoma increased in 2016 and 2017.
Will the trends continue?
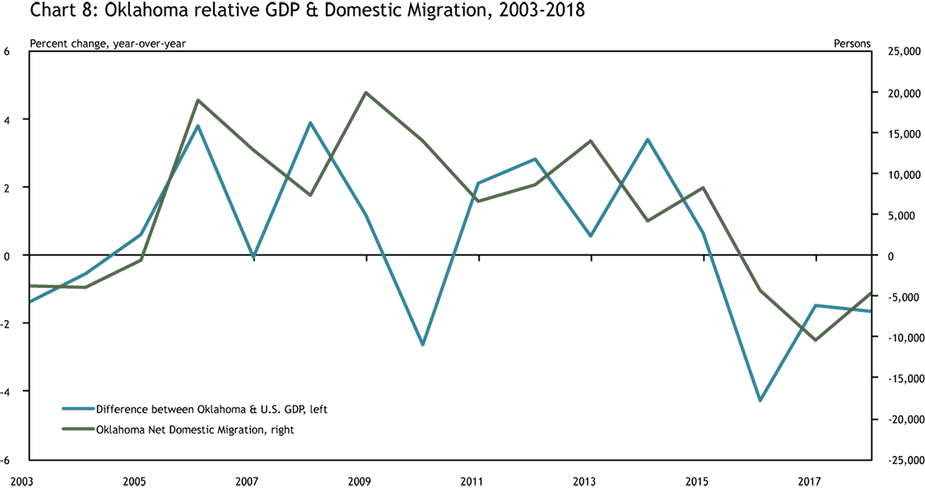
Net migration flows to and from Oklahoma in recent decades generally have mirrored the strength of the state’s economy relative to the nation. GDP in the state grew faster than the nation in most years from 2005 to 2015—years of positive net domestic migration flows. But these trends both reversed following the 2014-15 drop in oil prices and persisted through 2018, as GDP weakened and prime-aged workers moved out beginning in 2016 (Chart 8). Moreover, as the state’s economy and job opportunities became relatively worse, state government revenues declined. This resulted in sizable cuts to the Oklahoma state budget in 2016 and 2017, including to some key services for citizens such as education and health care, which may have exacerbated migration trends.
Sources: Bureau of Economic Analysis, Census Bureau, Haver Analytics, and authors' calculations.
History suggests Oklahoma’s overall domestic migration trends will improve as the state’s economy strengthens, particularly for prime-aged workers. But residents of some geographic areas and in some education categories have had longer-term out-migration trends. In particular, much of western Oklahoma has seen population losses since 1990, despite a good economy from 2005 to 2015. In addition, even prior to the state’s economic recession in 2015-16, Oklahoma already was losing more college graduates than it was gaining. Retaining and attracting this segment of the population remains key to increasing income levels of the general population and boosting the state economy.
_______________________________________________
Endnotes
-
1 ACS 1-year sample—Census Bureau. Estimated migration values differ between American Community Survey (ACS) data and Population and Housing Unit Estimates data. However, most data series shown in this article are for net domestic migration (inflows-outflows of U.S. residents).
-
2 Population and Housing Unit Estimates—Census Bureau
-
3 These numbers come from the American Community Survey—1 Year Sample Public Use Microdata and are different from the Population and Housing Unit Estimates. This is why net migration for Oklahoma here is different from what is shown in earlier charts.
The views expressed are those of the authors and do not necessarily reflect the positions of the Federal Reserve Bank of Kansas City or the Federal Reserve System.
Author